Logs and performance
Logcat
Run MoTA: Start Logcat to select multiple devices, or use a device's context menu. Output channels keep each device's stream separate.
- The default filter is
*:I. React Native users can useReactNative:V ReactNativeJS:V *:S. - You can also choose output format, log buffer, previous line count and an optional app package.
- App filtering follows the current PID; restart logcat after the app restarts.
- The last tag filter and package are remembered.
Run MoTA: Stop All Logcat Streams to stop them.
Device info and live stats
Run MoTA: Device Info and Live Stats, or use the dashboard icon in the Devices header, and optionally enter your app's package ID. The monitor shows battery, temperature, CPU, memory, app memory and janky-frame values for each device, with trend lines and warning flags. Select a device to see a history chart of CPU, memory, app memory, jank or temperature over the last 60 samples, and use Export CSV to save every sample.
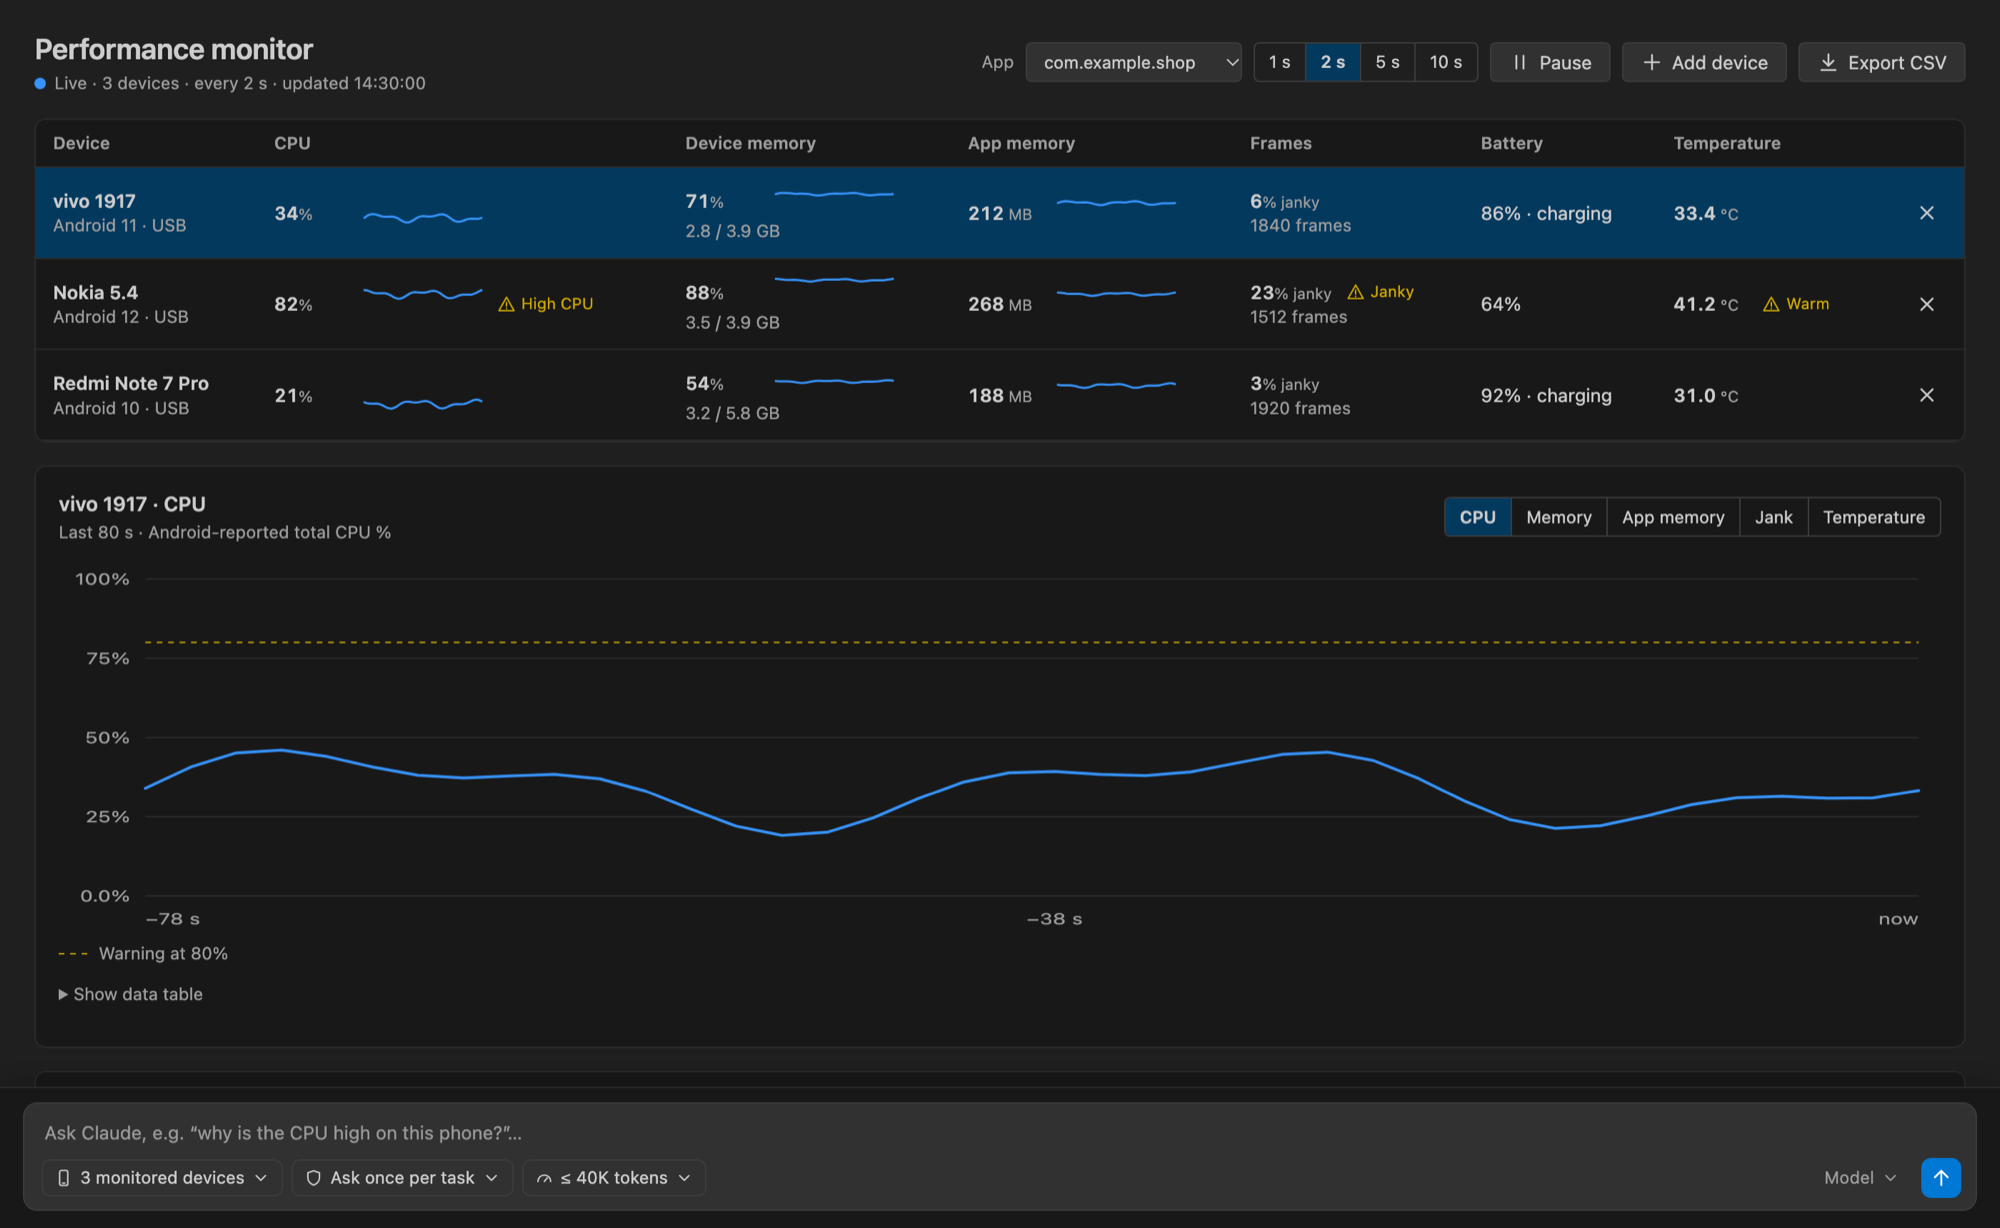
Change the app package and sampling interval (1, 2, 5 or 10 seconds) inside the page; pause/resume or refresh manually. Raw diagnostics are available in expandable details. Missing metrics display as unavailable. The app package is remembered per workspace.
| Metric | Source |
|---|---|
| CPU | dumpsys cpuinfo |
| Memory | /proc/meminfo and dumpsys meminfo |
| Frames | dumpsys gfxinfo |
These are Android diagnostics, not a precise real-time FPS profiler. Availability and format vary by device and Android version. No root access is requested.